
Image
Source
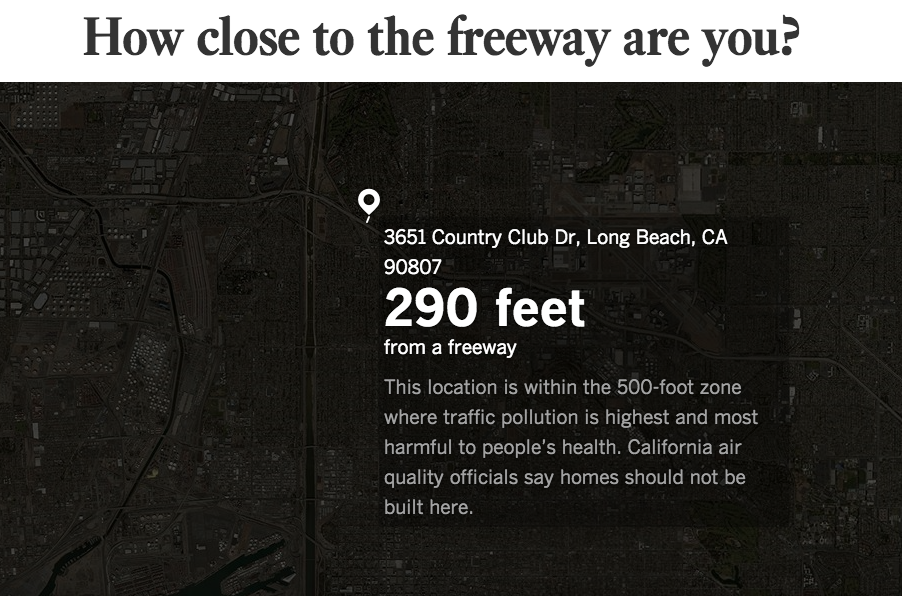
Barboza, Tony and Schleuss, Jon (2017a) How Close Are You?. Los Angeles Times. Screenshot taken from https://www.latimes.com/projects/la-me-freeway-how-close-map/
Barboza, Tony and Schleuss, Jon (2017b) Freeway Pollution. Los Angeles Times. https://www.latimes.com/pr
Schütz, Tim. 2018. “Freeway Pollution – How Close is Too Close?.” In Toxic News, created by Tim Schütz. In Visualizing Toxic Subjects Digital Exhibit, curated by James Adams and Kim Fortun. The Center for Ethnography. March.
Language
English
Contributor(s)
Group Audience
English
The image is ethnographically interesting for rendering abstract population and monitoring data personal. I am curious how this reconfigures the viewers understanding of both dwelling and moving through space on a daily basis.